Chesapeake Bay Restoration, Conservation to Benefit from New Approach to Data Mapping
First map of ground-mounted solar arrays provides new possibilities for land management planning and policy-making
WASHINGTON – Defenders of Wildlife and Chesapeake Conservancy have made a dataset available for the first time that will benefit the restoration and conservation of the Chesapeake Bay watershed and will have implications far beyond. This project was funded by a grant from the Grayce B. Kerr Fund, Inc. Using artificial intelligence (AI) and satellite imagery, the organizations have mapped ground-mounted solar arrays – a collection of multiple solar panels – to get an understanding of how solar is being built across the entire Chesapeake Bay watershed.
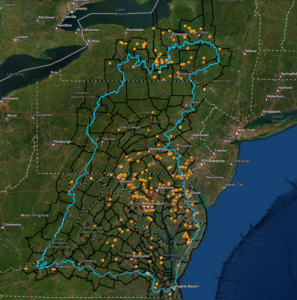 A complete, up-to-date inventory of solar arrays has never been available for the Chesapeake region before. This groundbreaking data will allow researchers in a variety of fields to understand patterns of solar development and estimate their environmental effects for the region. The preliminary data is available for download here and can be viewed in a web mapping application here. The website allows viewers to explore the mapped solar arrays over high-resolution imagery. See an example image of the website here.
“This is the first time that a detailed map of solar arrays has been made available for the entire Chesapeake watershed,” said Michael Evans, senior conservation data scientist at Defenders of Wildlife. “Using artificial intelligence to map features like solar arrays is a breakthrough for land use management, conservation, and renewable energy, and we’re excited to make these data publicly available. While we are interested in better understanding land use dynamics in the Chesapeake Bay watershed, other researchers can use these maps to solve other important conservation challenges.”
The AI model developed by Defenders and Chesapeake Conservancy uses free and publicly available 10m satellite imagery produced by the European Space Agency, which collects new images of the Earth about every five days. The model can be used to easily update maps of solar arrays as satellite imagery is collected and will allow tracking of the growth and location of solar energy across the landscape. The organizations plan to publish the model and code later this year.
“The best part of this model is that it can be easily scaled up for mapping solar arrays for the entire United States,” said Kumar Mainali, geospatial data scientist at Chesapeake Conservancy. “The beauty of AI is that it learns more from a bigger dataset. Therefore, an exercise of scaling up an AI model with more data makes it more reliable in detecting solar arrays. Given the nature of the data, this model can be used to generate the solar array mapping rapidly every season.”
In the Chesapeake, one area of interest is understanding how land use changes associated with solar energy development affect water quality in the watershed. Clean watersheds are vital in providing clean drinking water for people and wildlife, as well as providing important habitats for plants and animals.
The ways that a growing solar energy footprint impacts water quality in the Chesapeake Bay watershed are complex. On the one hand, solar panels can increase runoff that carries pollution because they are impervious surfaces ‒ surfaces that are not easily penetrated by water. On the other, depending on the land use that the panels are replacing and other factors such as soil type or vegetation cover underneath the panels, they may benefit water quality. For example, replacing agricultural land with solar arrays may result in using less fertilizer. Importantly, an increase in solar capacity will also likely lead to a decrease in greenhouse gas emissions and other deposition of air pollutants to the watershed as renewable energy replaces fossil fuel energy sources (e.g., replacing coal-fired power plants with cleaner energy sources).
The new solar array data will be an input to the high-resolution land cover and land use datasets being produced by Chesapeake Conservancy and the University of Vermont as part of a Chesapeake Bay Program agreement. The Bay Program uses this data in the Chesapeake Assessment and Scenario Tool (CAST) ─ a model that accounts for nonpoint sources of sediment, nitrogen, and phosphorus pollution to waterways and tracks efforts to reduce pollution by implementing Best Management Practices.